
The main application window (picture below) contains a toolbar a code editor view, a register view, a clock cycle view and a status bit view.
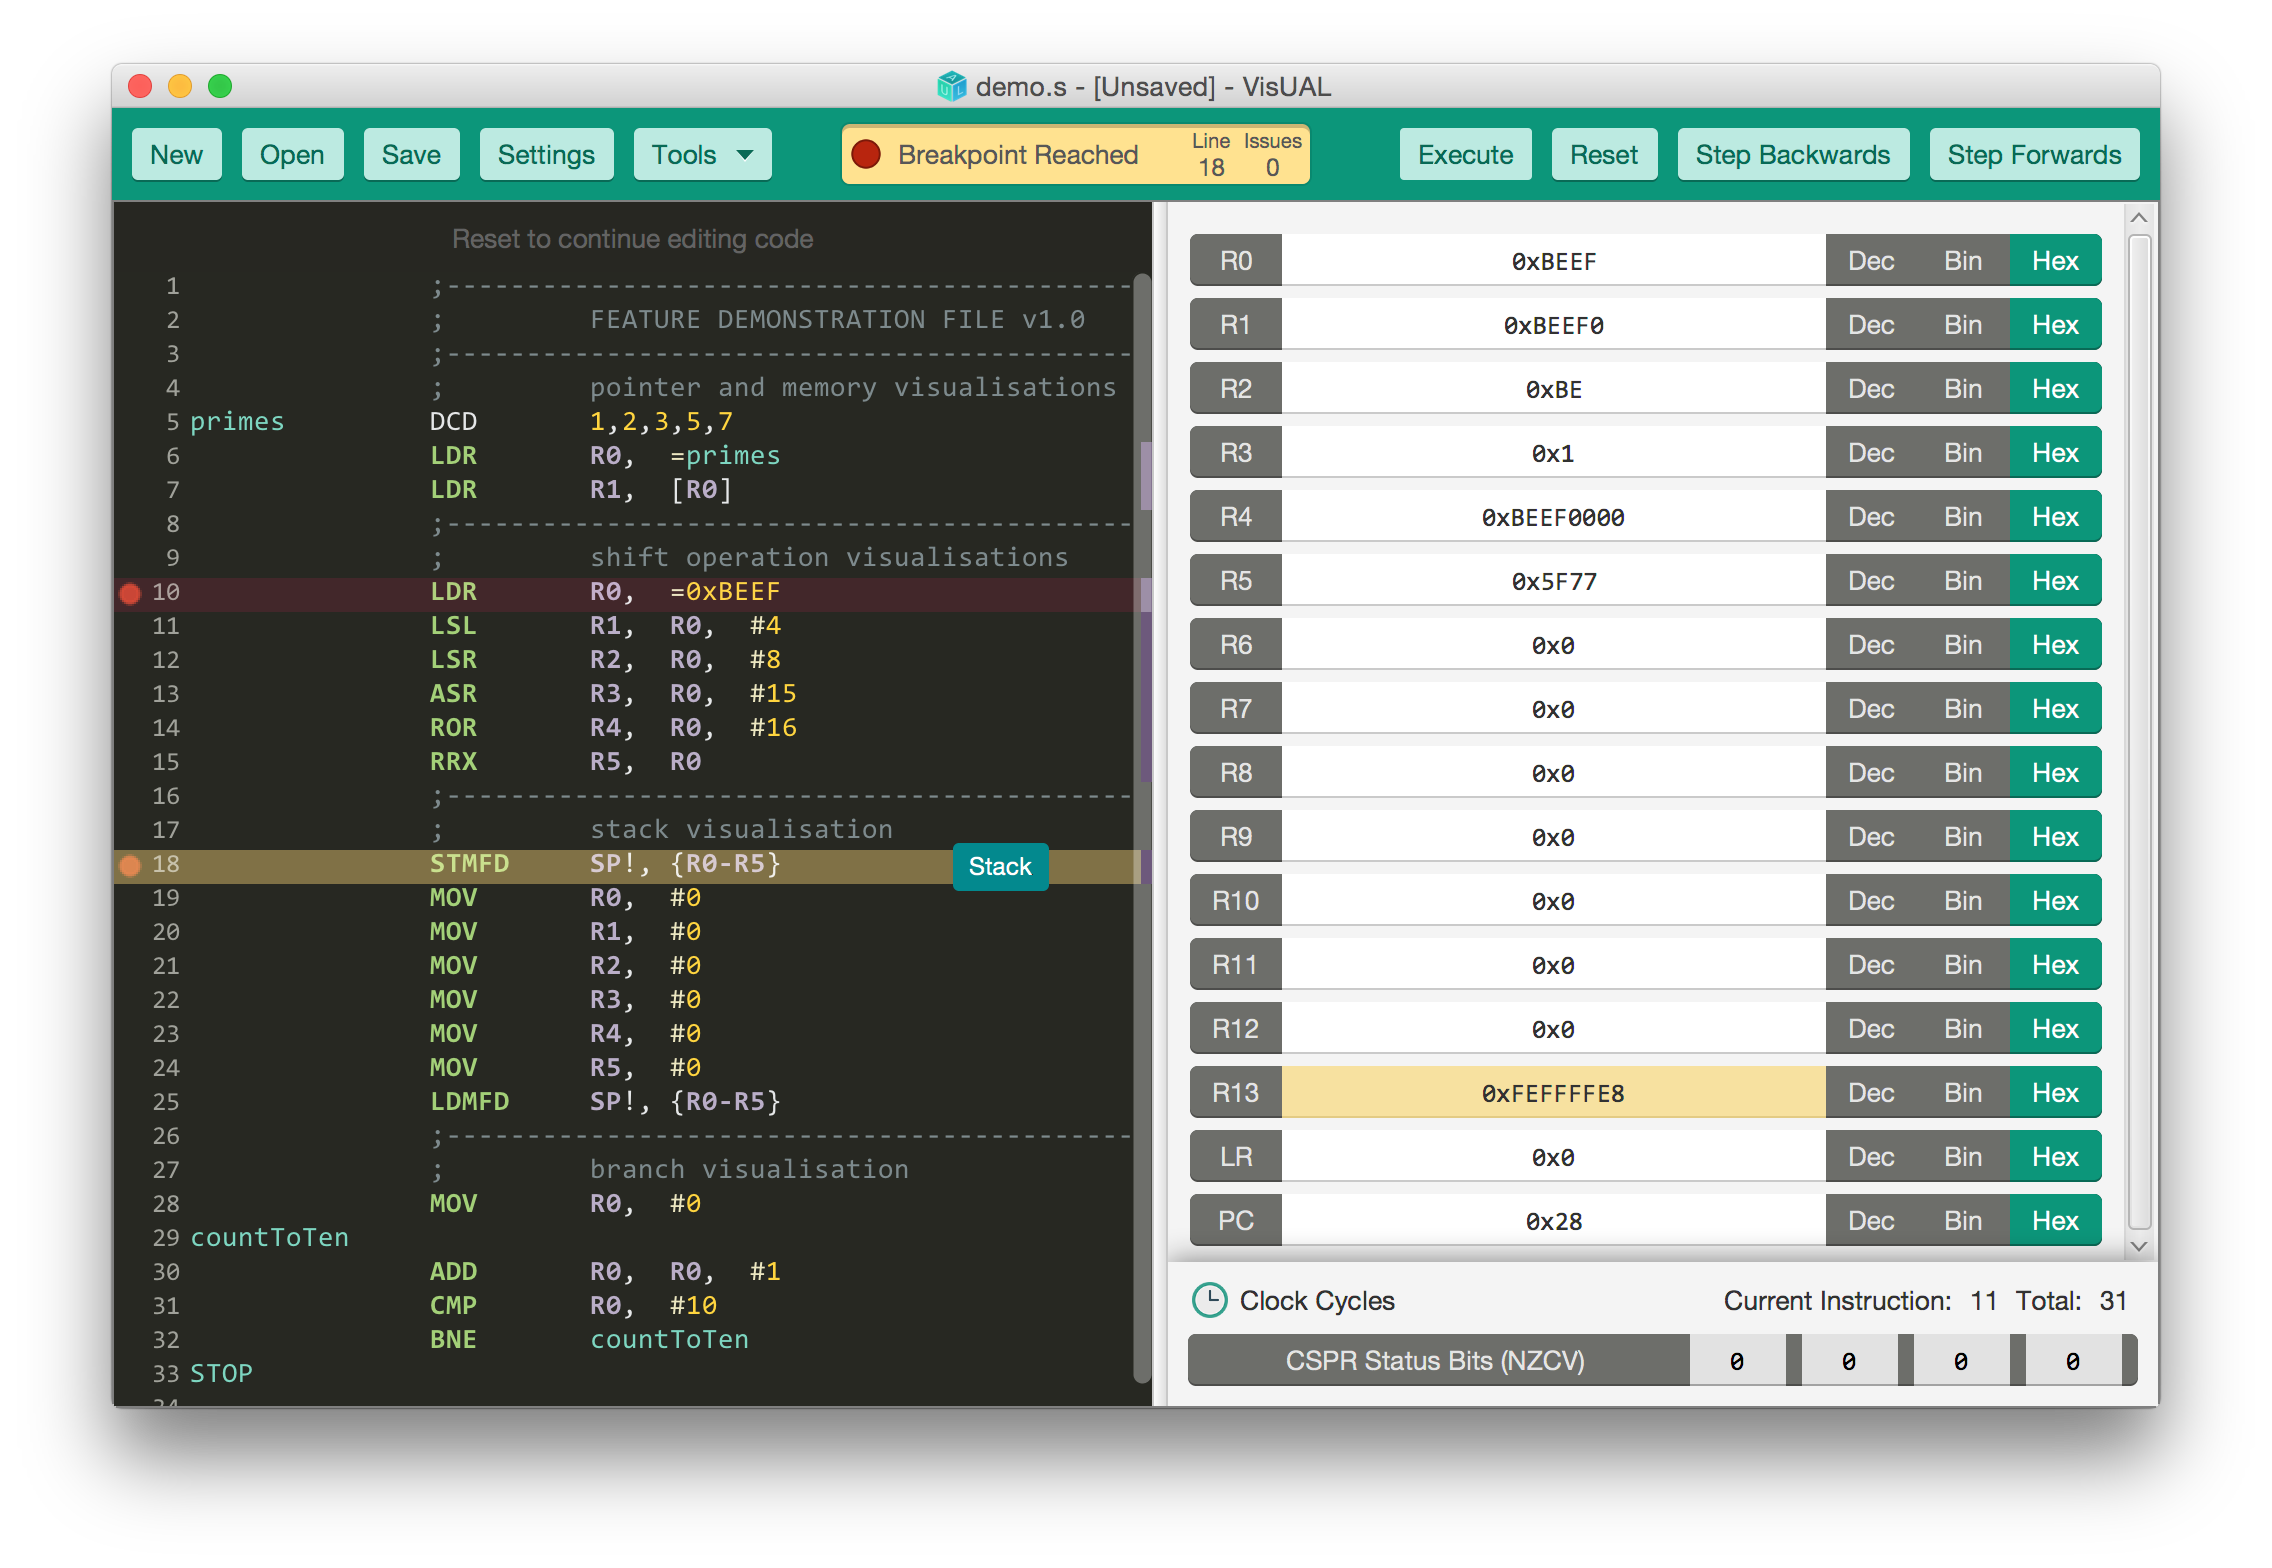
The toolbar has two button groups: utility buttons and debugging buttons. It also contains a status bar that provides information regarding the emulator state.

These buttons provide access to file management functions, the Settings panel, and a toolbox. The functions are as follows:
| Button | Action | Shortcut |
|---|---|---|
| New | Create new file | Shortcut+N |
| Open | Open an existing file | Shortcut+O |
| Save | Save changes | Shortcut+S |
| Settings | Open settings panel | Shortcut+, |
| Tools > Auto-indent code | Automatically re-indents typed code | Shortcut+Alt+I |
| Tools > View memory contents | Opens a window showing the memory contents | Shortcut+Alt+C |
| Tools > View symbols | Opens a window showing all defined symbols | Shortcut+Alt+Y |
Shortcut is Ctrl for Windows and Linux, and Cmd for Mac OS X.

These buttons provide access to the debugging functionality of the application. A summary of these functions is given below. For full details, see the Debugging Guide.
| Button | Action | Shortcut |
|---|---|---|
| Execute | Run to breakpoint or end of file | F5 |
| Reset | Reset emulator | F6 |
| Step Backwards | Step back one line | F7 |
| Step Forwards | Step forwards one line | F8 |
The status bar provides useful information regarding the state of the emulator. It consists of a status message, a line number and the number of issues. Examples of all possible states are as follows:
| State | Example | Description |
|---|---|---|
| Off |  |
Emulation disabled |
| Analysing |  |
Code is being prepared for emulation |
| Running |  |
Emulation is in progress |
| Resetting |  |
Emulator is being reset |
| Browsing |  |
Browsing history using Step Backwardsor register history browsing. |
| Complete |  |
Emulation has completed successfully |
| Breakpoint | 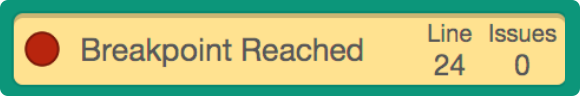 |
Emulation is paused due to a breakpoint |
| Syntax Error | 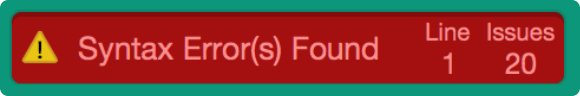 |
Emulation aborted due to syntax error(s) |
| Runtime Error | 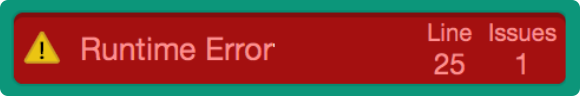 |
Emulation aborted due to a runtime error |
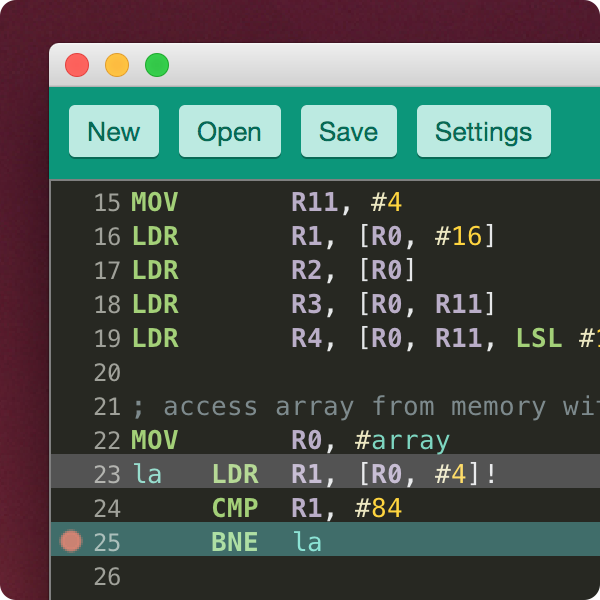
The code editor provides syntax highlighting for ARM Assembly programs. Breakpoints can be added by clicking a line number. Line numbers are highlighted based on their execution status. Visualisation buttons are shown in-line with code as an overlay on the code editor.
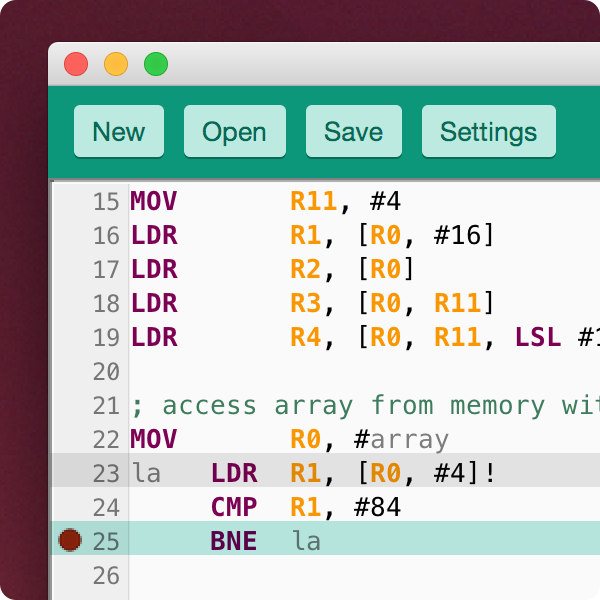
A choice of two themes is available from the Settings panel. The default is a Dark theme, but a Light theme is also available.
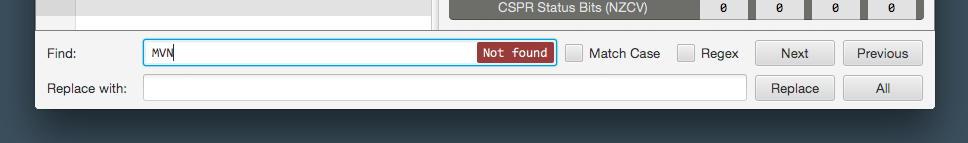
Find and replace functionality is available and can be activated by Shortcut+F, where Shortcut is Ctrl on Windows and Linux and Cmd on Mac OS X.
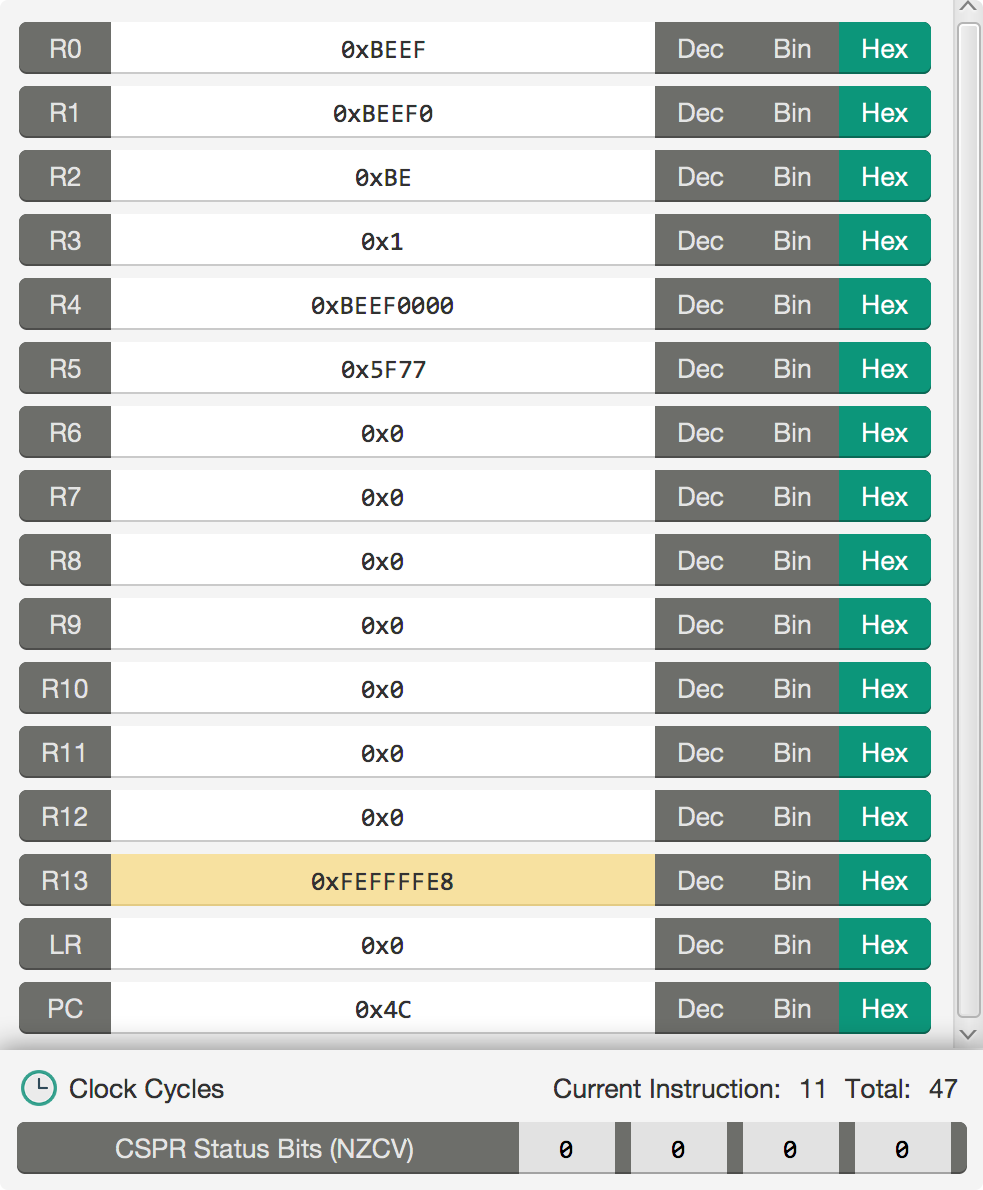
The register view element contains a list of register values, a clock cycle view, and a status bar view.
Individual register values for registers R0-R15 are displayed. Clicking on the buttons Dec, Bin, Hex changes the display format for individual register values. The format can be changed universally using the Settings panel. If a register value is changed by the current instruction, it will be highlighted yellow.
This is under the register view and displays the clock cycles for the current instruction as well as the total number of clock cycles since emulation started.
This displays the 4 CSPR condition flag status bits N (negative), Z (zero), C (carry) and V (signed overflow). Individual bits are highlighted upon conditional and when changed.