
VisUAL provides step-by-step debugging functionality as well as the ability to execute code to the end of the program.
Depending on the execution status of a line, it will be highlighted differently.
| Execution Status | Highlight colour |
|---|---|
| Normal | Yellow |
| Predicated true | Green |
| Predicated false | Red |
| Link register instruction | Purple |
| Branch destination | Grey |
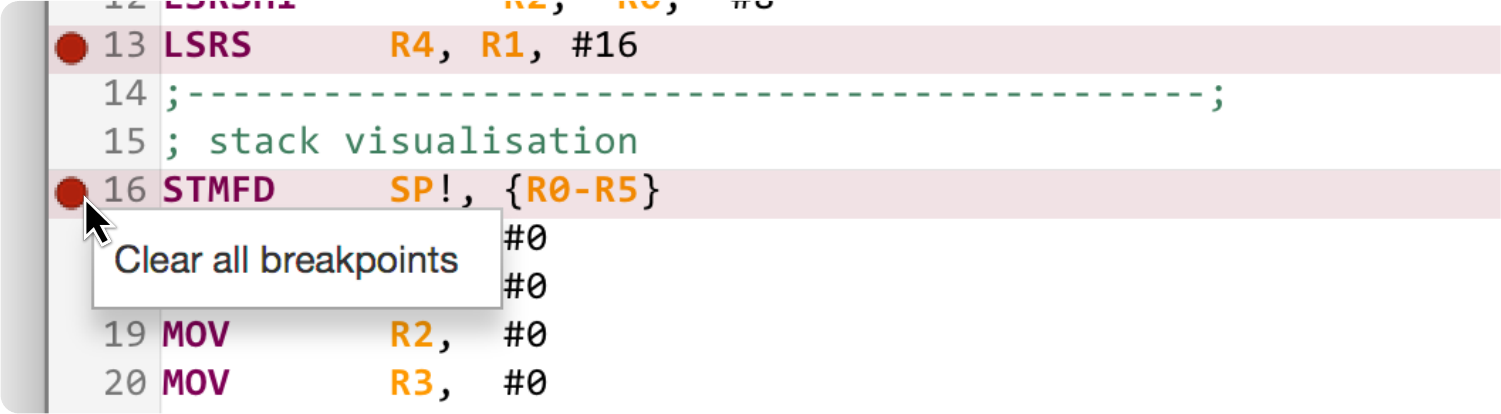
Breakpoints can be toggled on/off on any line by clicking the corresponding line number. To clear all breakpoints, right click in the line number area and select Clear All Breakpoints.
Debugging can be performed on a line-by-line basis using the debugging buttons in the main window toolbar and shown below.

Click on Step Forwards to execute he next line of code. The emualator will pause after that line of code has been executed. Click on Step Backwards to restore the program state the previous line of code. Execute will automatically step through all code until a breakpoint or the end of the file is reached.
To exit debug mode, press the Reset button. This resets the emulator and clears the register history values.
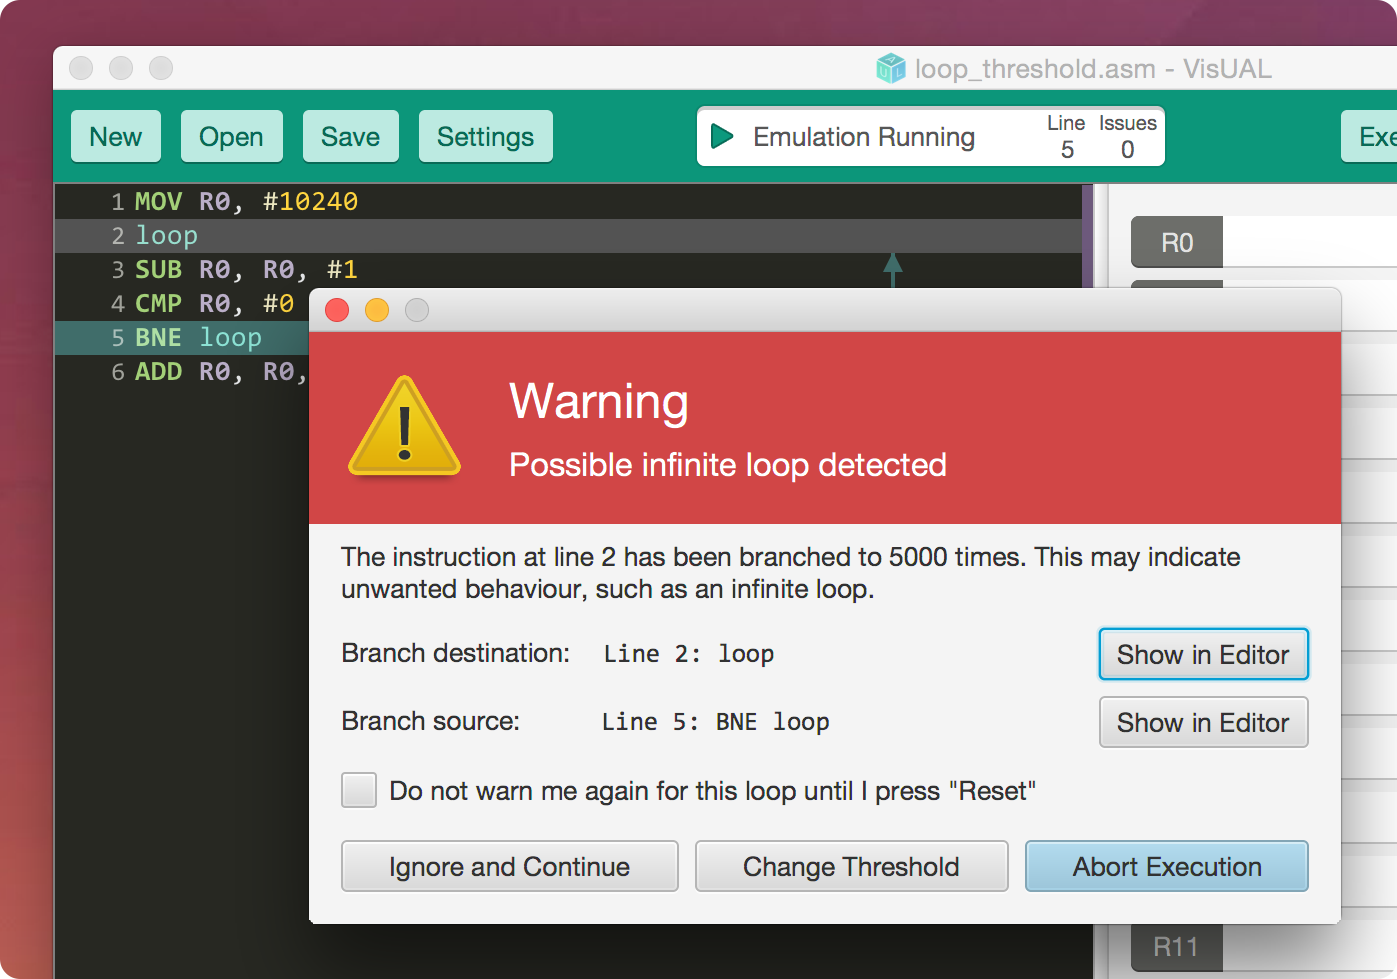
If you accidentally write an infinite loop, or the number of loop iterations exceed a specified threshold, a warning message will be displayed. You have a number of options for how to proceed when you see this warning.
| Option | Description |
|---|---|
Do not warn... |
Warnings for this loop will be ignored until you press Reset |
Ignore and Continue |
Ignores this warning. The next warning will be shown when the threshold is hit again |
Change Threshold |
Shows a dialog to specify a new threshold to use. The warning window remains open |
Abort Execution |
Stops execution and resets the emulator |
Show in Editor |
Scrolls to the branch destination / source in the code editor. The warning window remains open |