
Memory visualisations are designed to show memory access for the load/store instructions LDR, LDRB, STR, STRB. The visualisation can be viewed by using the button Show Memory that automatically appears when needed, or by using the keyboard shortuct Shortcut+Alt+M if the visualisation has been disabled via the settings panel.
Shortcut is Ctrl for Windows and Linux, and Cmd for Mac OS X.
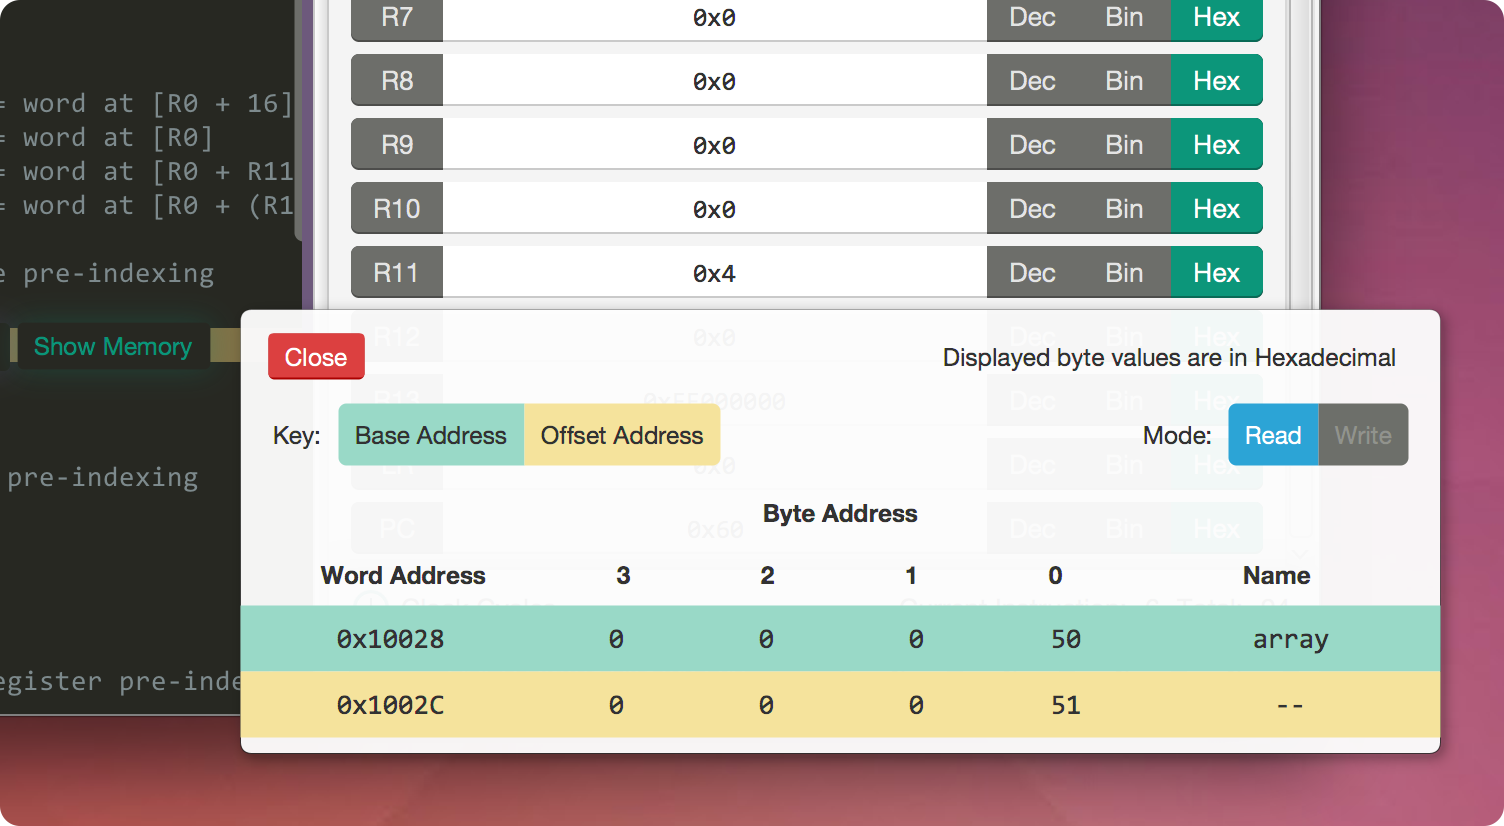
The following information is provided in the memory visualisations:
| Item | Description |
|---|---|
| Base address | The word in memory, displayed as individual bytes, at the corresponding pointer base address |
| Offset address | The word in memory, displayed as individal bytes, at the corresponding pointer base+offset address |
| Mode | Read when using LDR or LDRB; Write when using STR or STRB |
This window can be used to monitor memory locations within a specified address range. It is accessible using the Tools drop-down menu or via the keyboard shortcut Shortcut+Alt+C.
Shortcut is Ctrl for Windows and Linux, and Cmd for Mac OS X.
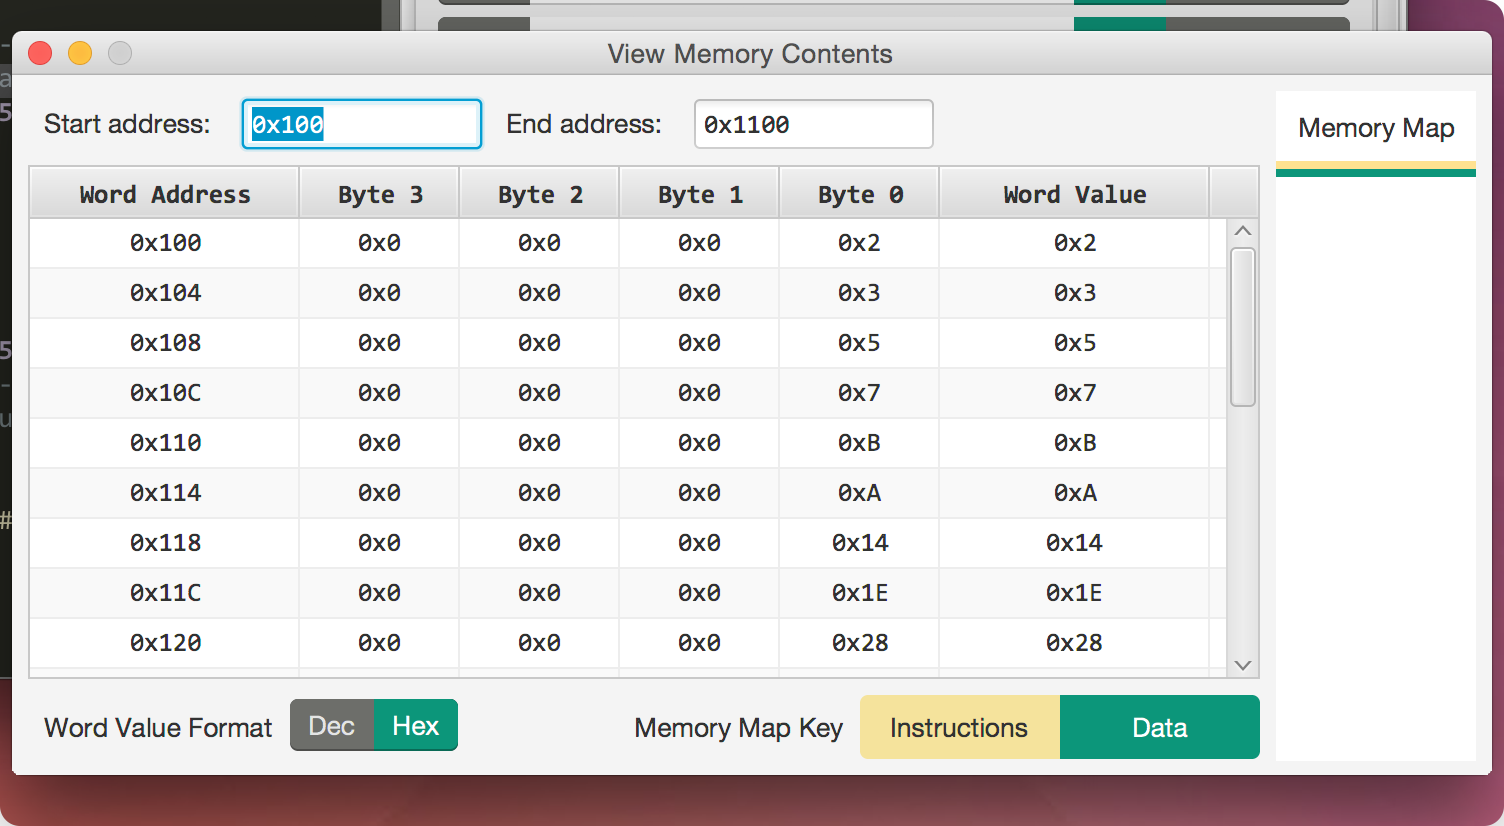
The following parameters can be configured in the view memory contents window:
| Item | Description | Default Value |
|---|---|---|
| Start address | The starting address of the range of memory values to display | The first available address in the data memory region |
| End address | The end address of the range of memory values to display | 0x1000 + the start address |
| Display format | Select the base used to display word values in memory | Hexadecimal |
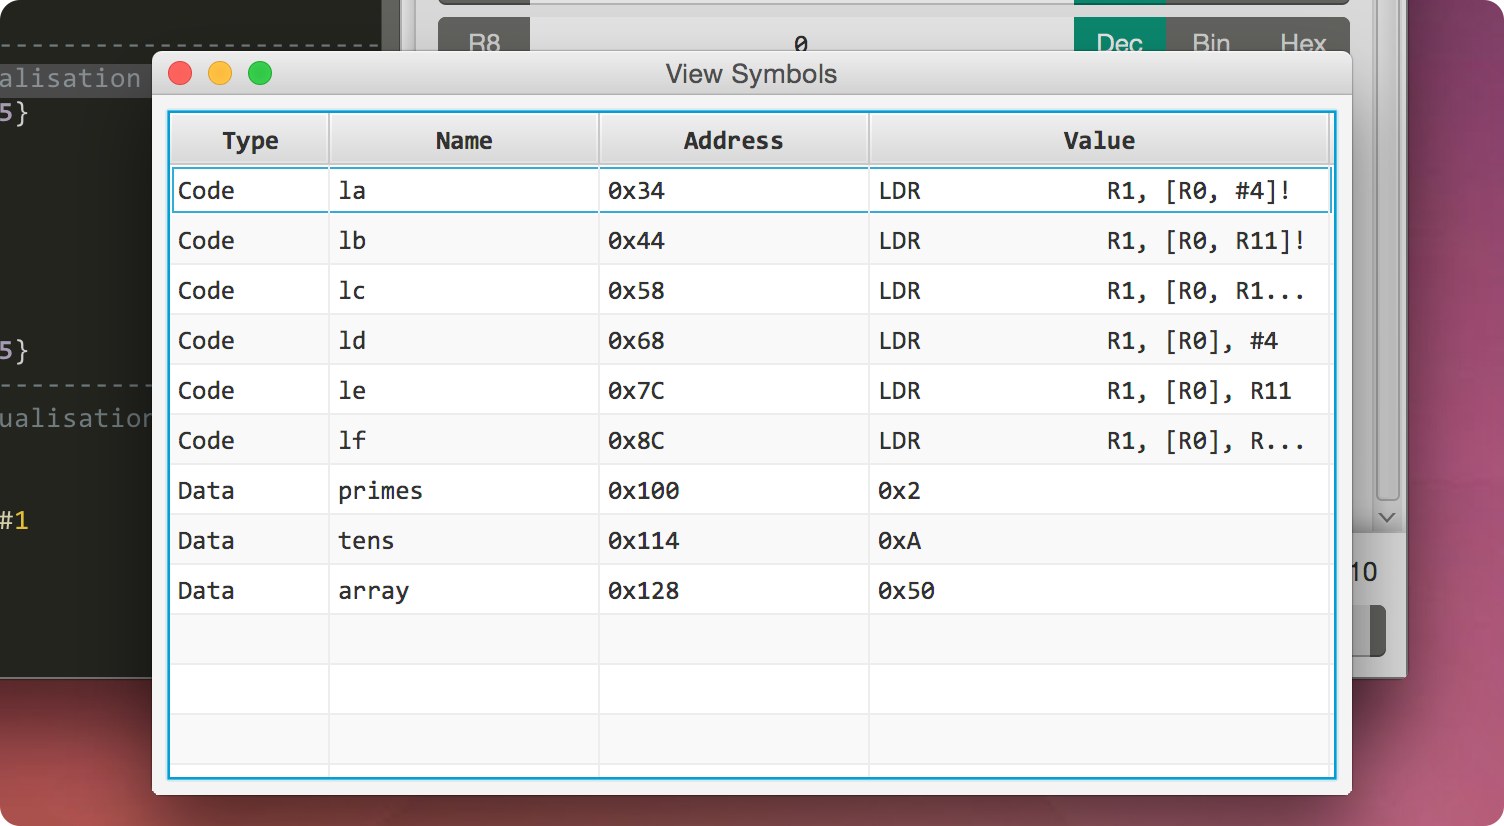
This window can b used to monitor any symbols defined in memory while emulation is running. It can be accessed using the Tools drop-down menu or via the keyboard shortcut Shortcut+Alt+Y.
Shortcut is Ctrl for Windows and Linux, and Cmd for Mac OS X.
There are no configurable parameters for this window.